Long-Term Management Plan 2030LONG-TERM MANAGEMENT PLAN
1. Goals of this Management Plan 1.Management Plan Aims
2. Preconditions and indicators for achieving quantitative targets 2.Key Assumptions for Quantitative Target
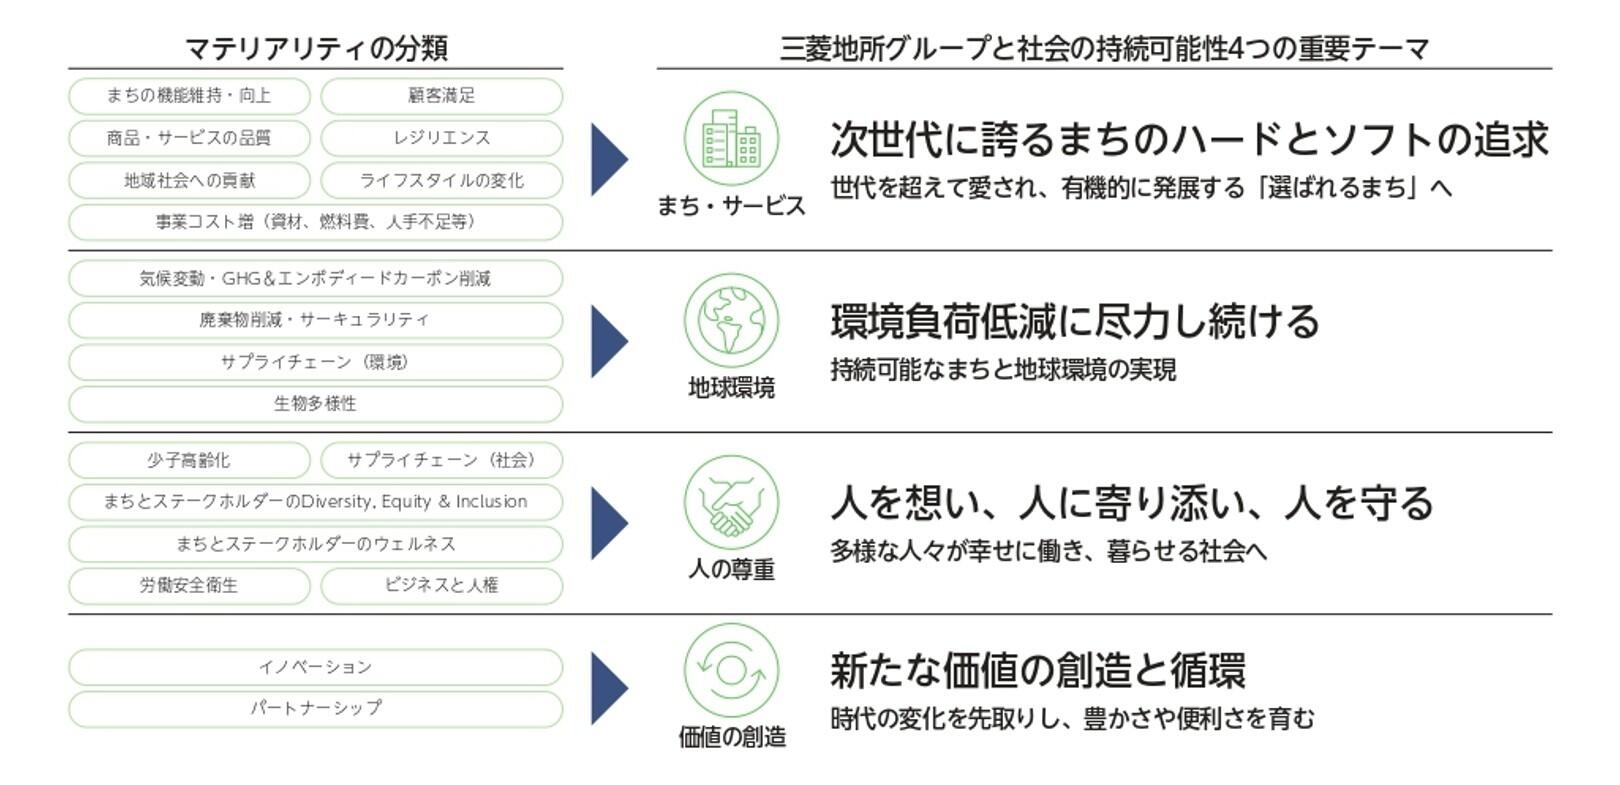
3. [Social Value Improvement Strategy] Materiality and Four Important Themes 3.[Increasing Social Value] Material Issues and Four Key Themes
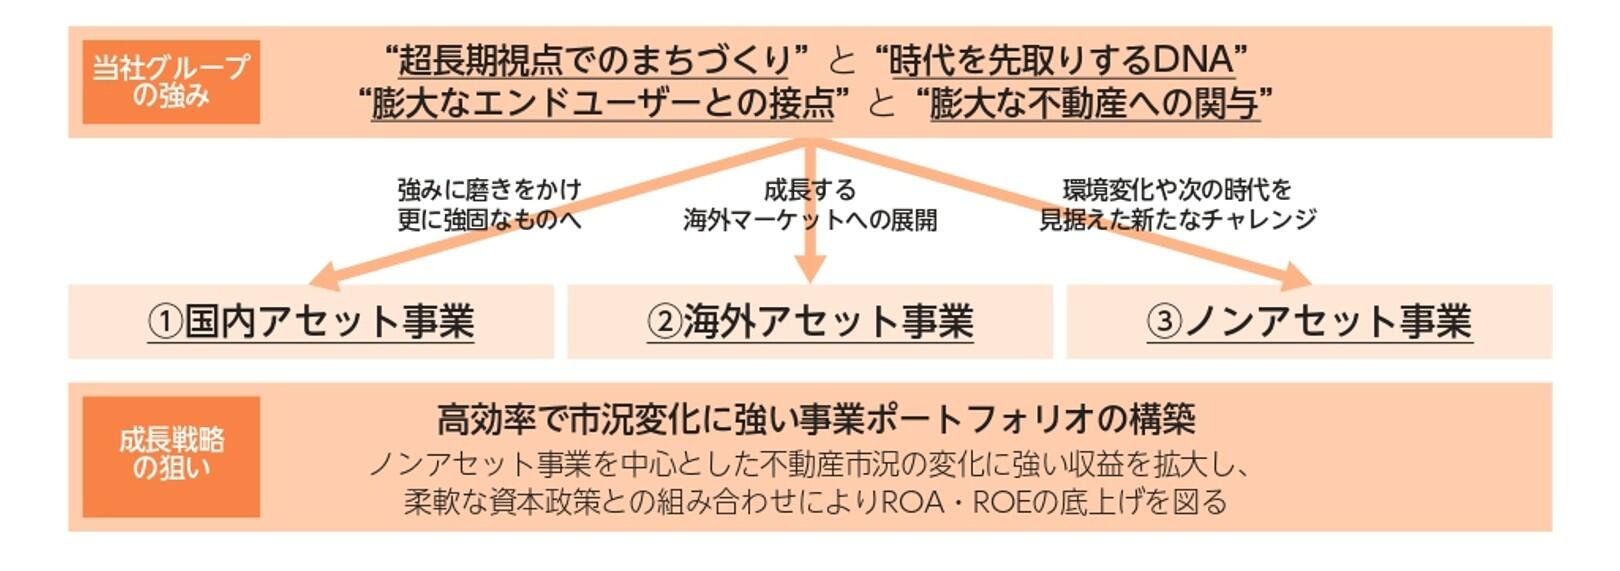
4. [Shareholder Value Improvement Strategy] our group 's Strengths and Growth Strategy 4.[Increasing Shareholder Value] Strengths and Growth Strategy of the Group
1. Background of formulation of “Long-Term Management Plan 2030” 1.Background of Formulation of Long-Term Management Plan 2030
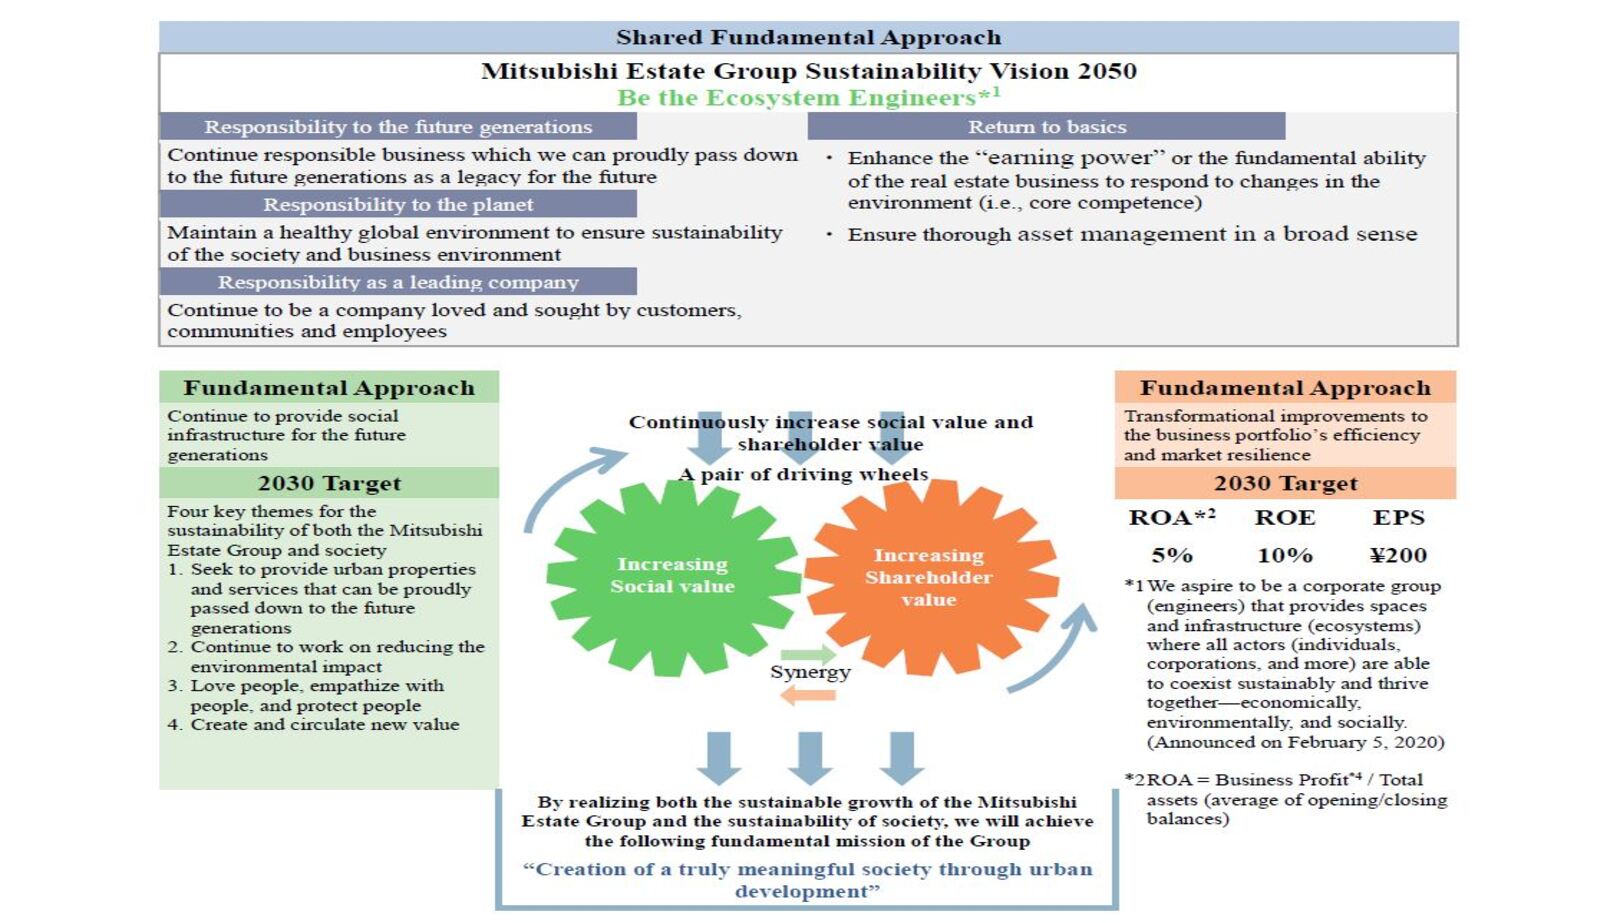
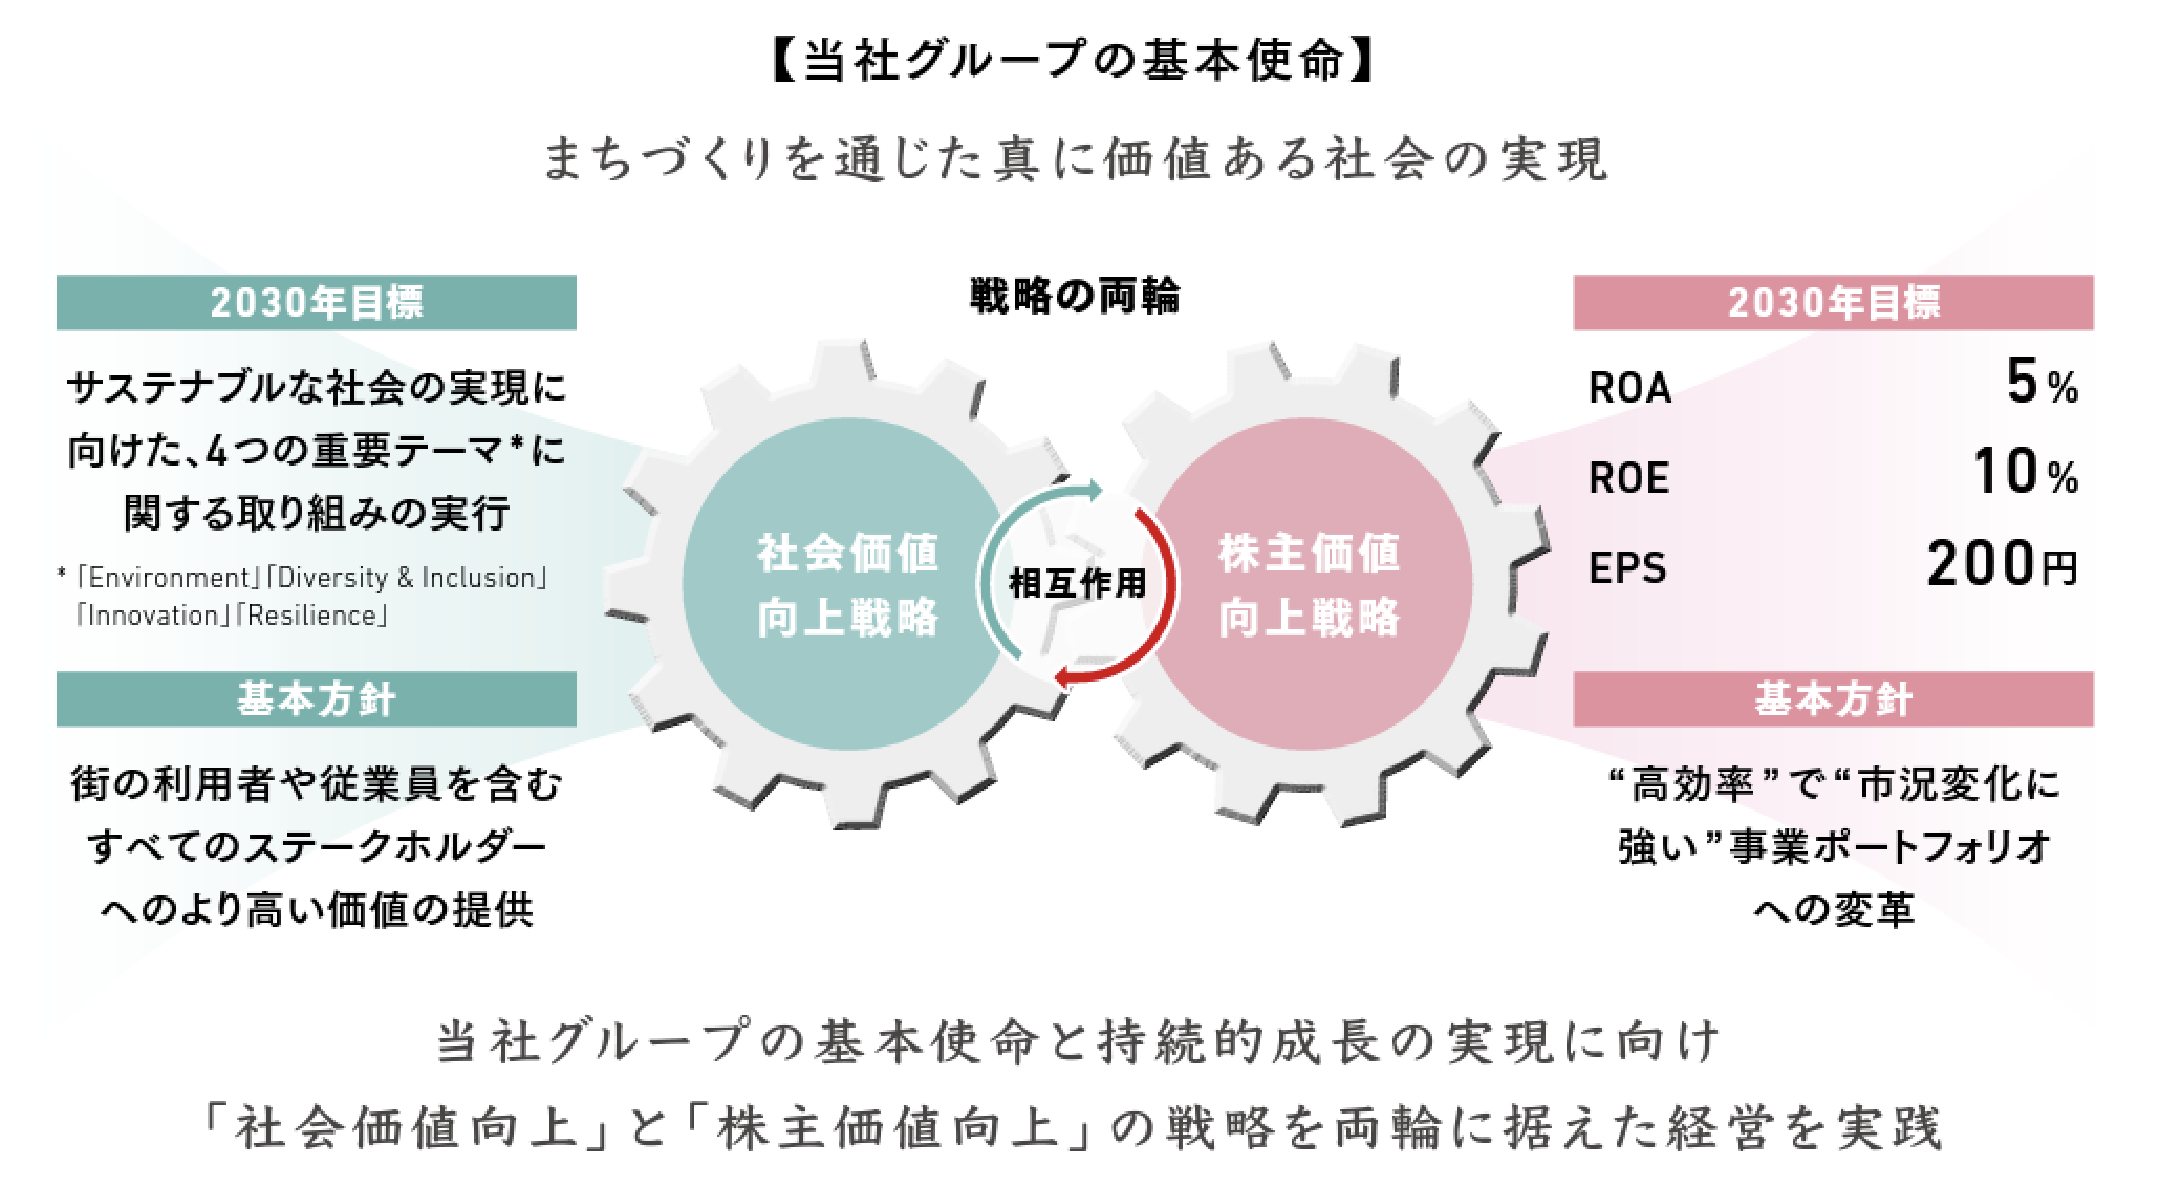
2. Vision for management plan 2.Management Plan Aims
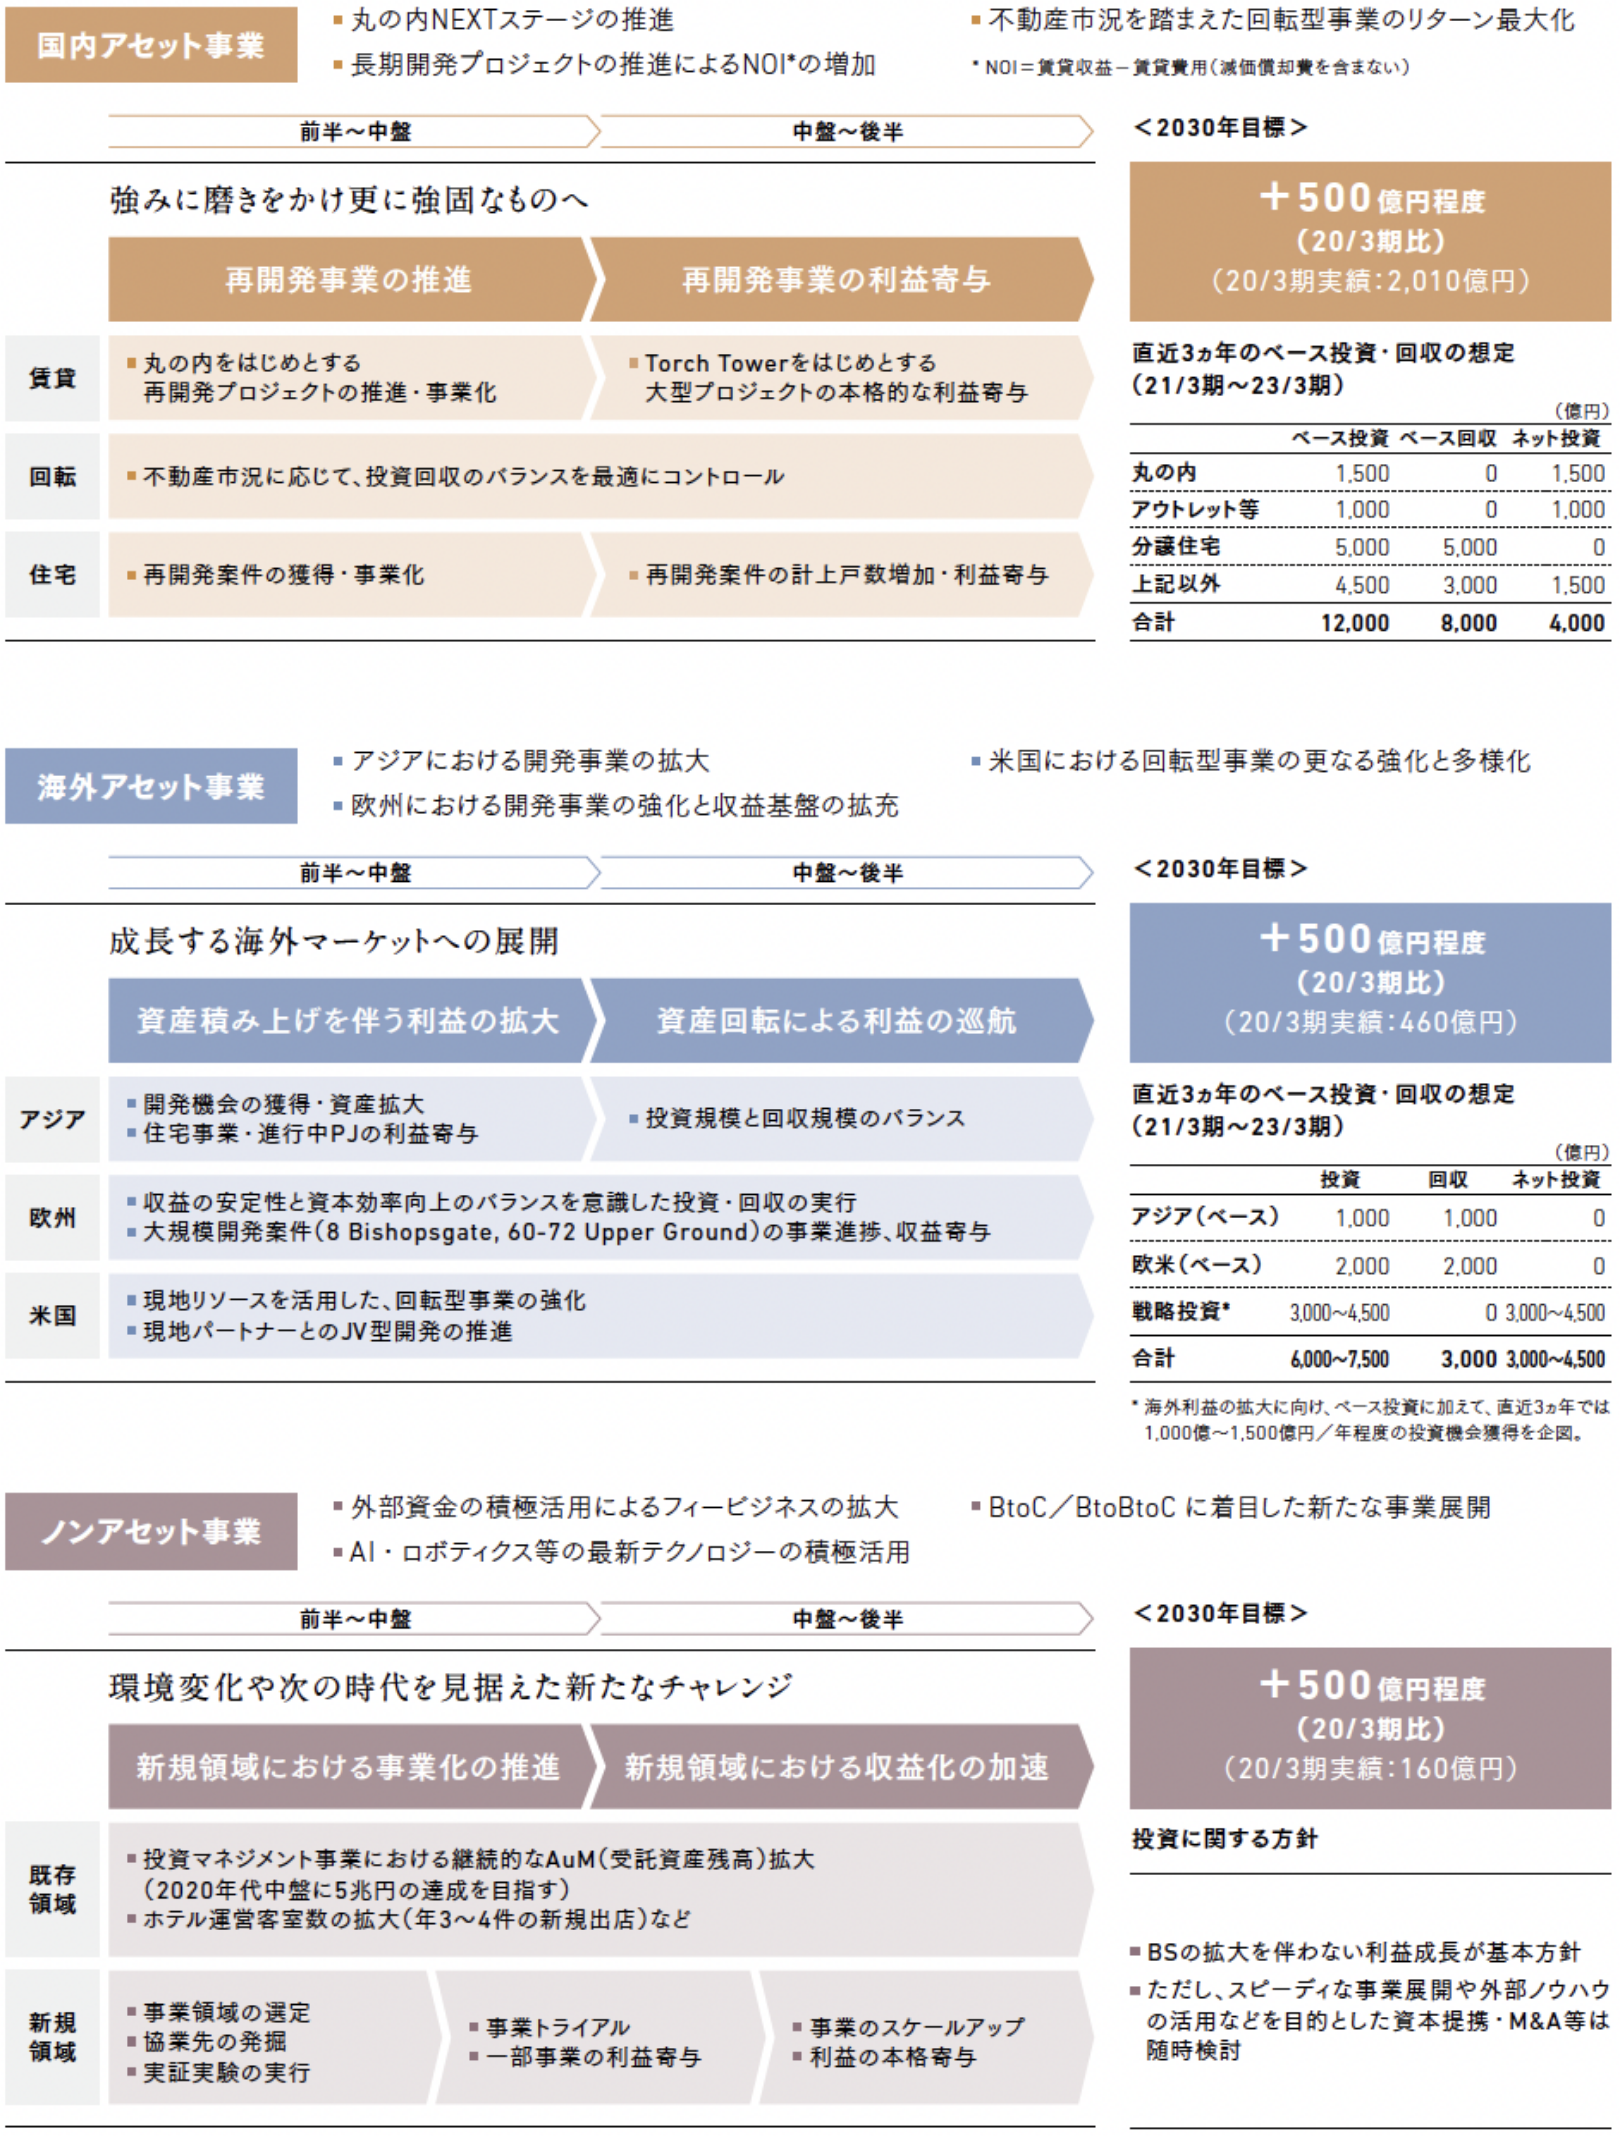
3. our group strengths and growth strategies3.Mitsubishi Estate’s Strengths and Growth Strategy
Four. Numerical target4.Quantitative Target
(1)2030年の計数目標(1) Quantitative Target for 2030※括弧内は20年3月期予想(2019年5月14日公表値)*The Figures in brackets are estimates for FY2020 (announced May 14, 2019)
| ROA※1 | ROE※2 | EPS※3 | |
|---|---|---|---|
| 5% (3.9%) | 10% (7.8%) | 200円 (100.20円) | 200 yen(100.20 yen) |
| ROA※1 | 5% (3.9%) | |
|---|---|---|
| ROE※2 | 10% (7.8%) | |
| EPS※3 | 200円 (100.20円) | 200 yen(100.20 yen) |
(2) 目標達成に向けた前提・指標(2) Key Assumptions for Achievement of Targets
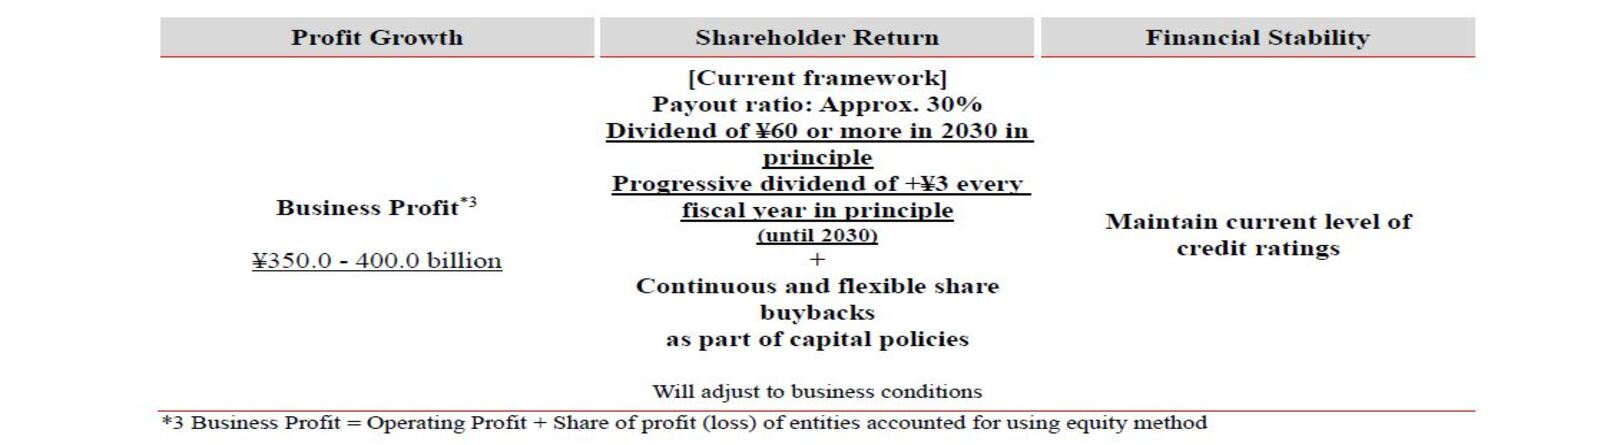
| 利益成長 | 株主還元 | 財務健全性 | Profit Growth | Shareholders Return | Financial Stability |
|---|---|---|---|---|---|
|
事業利益※4 3,500~4,000億円程度 |
配当性向:30%程度 + 資本政策の一環としての 自己株式の取得 ただし、不動産市況・投資環境・株価・ROE/EPSの状況等に応じて、株主還元の手法や規模感については柔軟に検討 |
現状の格付水準が維持可能な 財務健全性の確保 【参考】現状格付 R&I:AA- S&P:A+ MOODY’S:A2 |
Business Profit*4: ¥350-400 billion yen |
Current framework* Payout ratio: Approx. 30% + Share buybacks (when determined to be optimal use of funds) *Will adjust to business conditions |
Maintain current level of credit ratings 【Reference】 R&I:AA- S&P:A+ Moody’s:A2 |
| 利益成長 |
事業利益※4 3,500~4,000億円程度 |
Profit Growth |
Business Profit*4: ¥350-400 billion yen |
|---|---|---|---|
| 株主還元 |
配当性向:30%程度 + 資本政策の一環としての自己株式の取得 ただし、不動産市況・投資環境・株価・ROE/EPSの状況等に応じて、株主還元の手法や規模感については柔軟に検討 |
Shareholders Return |
Current framework* Payout ratio: Approx. 30% + Share buybacks (when determined to be optimal use of funds) *Will adjust to business conditions |
| 財務健全性 |
現状の格付水準が維持可能な 財務健全性の確保 【参考】現状格付 R&I:AA- S&P:A+ MOODY’S:A2 |
Financial Stability |
Maintain current level of credit ratings 【Reference】 R&I:AA- S&P:A+ Moody’s:A2 |
※1 ROA=事業利益※4 ÷ 総資産(期首期末平均)
※2 ROE=親会社株主に帰属する当期純利益 ÷ 自己資本
※3 EPS=親会社株主に帰属する当期純利益 ÷ 期中平均株式数
※4 事業利益=営業利益+持分法投資損益。尚、事業利益については、ノンアセット事業の成長をはじめ、スピード感をもった事業展開を目指す上で、第三者との協業が従来以上に重要であり、それら事業からのリターンも含めた利益をモニタリングするために設定。
※1 ROA=Business Profit*4 ÷ Total assets (average)
※2 ROE=Profit attributable to owner of parent ÷ Shareholders' equity (average)
※3 EPS=Profit attributable to owners of parent ÷ Average number of shares for the fiscal year
※4 Business Profit=Operating Profit + Equity in earnings (loss) unconsolidated subsidiaries and affiliates. The Company aims for speedy business expansion, especially growth of Non-Asset Business and collaboration with third parties will, therefore, be more important than ever. Accordingly, the Company set a core operating income target to monitor profit including returns from these joint ventures.